
Appearance
6. Build your own report
When you need this: none of the ready made reports has quite the columns you want. The council wants customers by town with their balance. The engineer wants work orders with the address and the cost. Pick the columns yourself, and save it so you can run it again.
Steps
On the left side of the screen, click Reports & Analytics, then click Custom Report Builder.
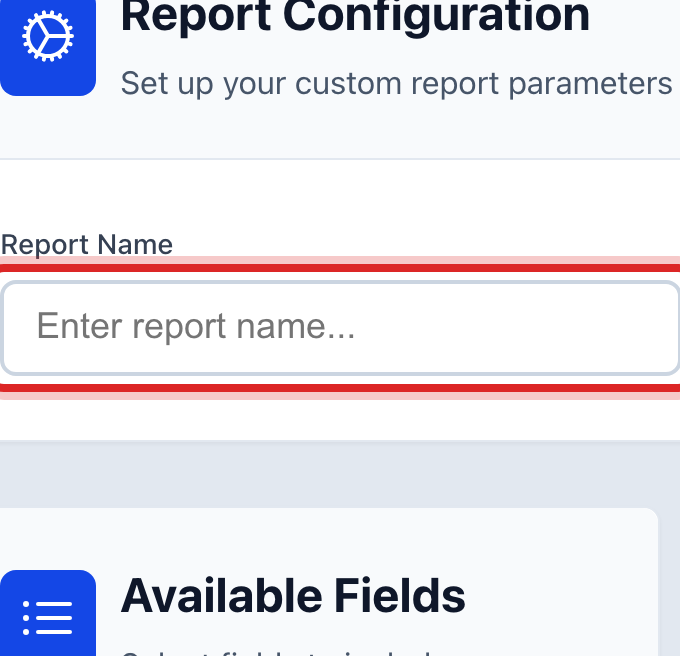
At the top of the page, click in the Report Name box. Type a name, like "Customers by town".
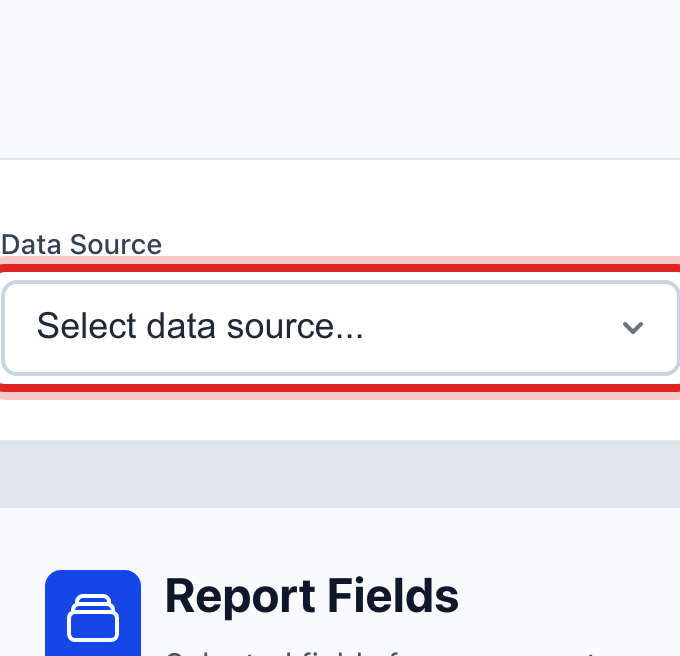
Click the Data Source list. Pick where the rows come from, like Customer Management or Work Orders.
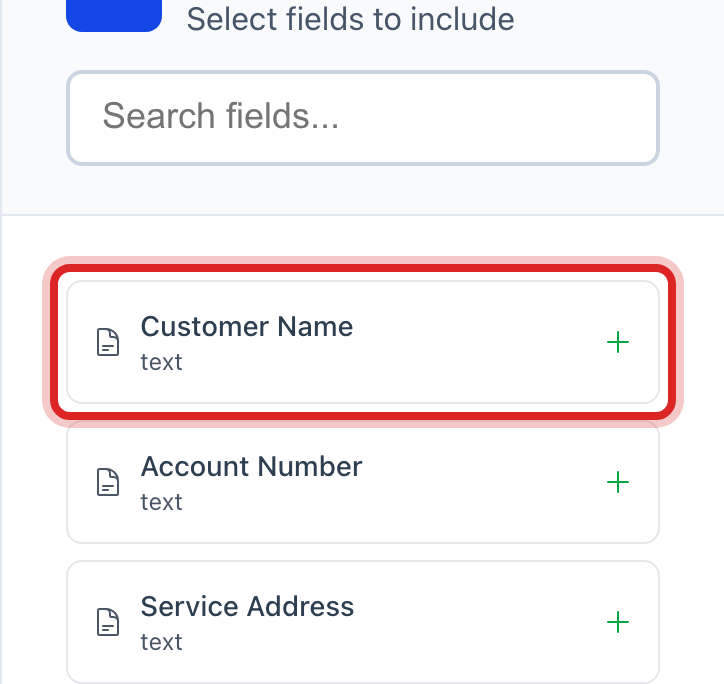
The Available Fields card fills with every column you can use. Click a field to add it. It moves to the Report Fields card. Add each column you want, in order.
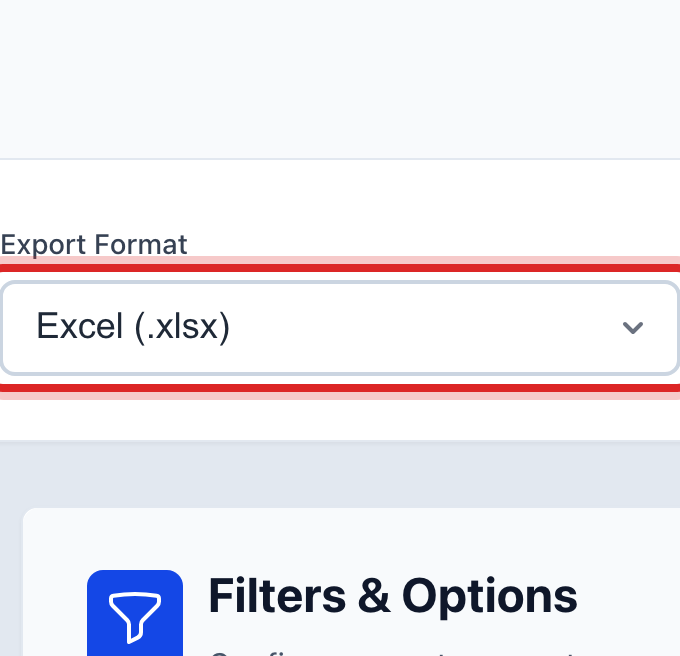
Click the Export Format list. Pick Excel (.xlsx) for a spreadsheet or PDF (print view) for paper.
Scroll down to Report Preview to see the first rows. If a column is wrong, click the small x on it under Report Fields.
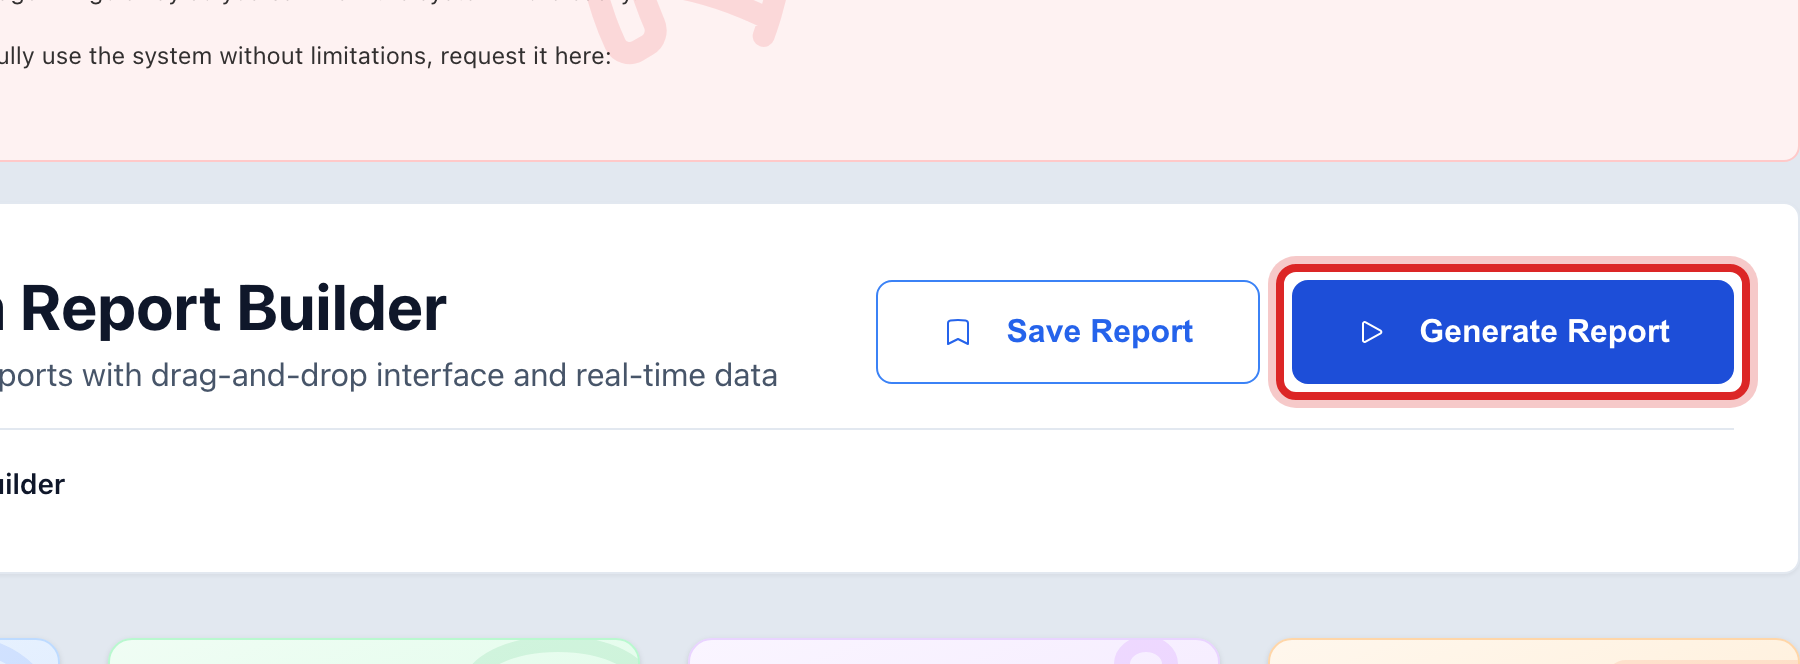
Click the blue Generate Report button at the top of the page.
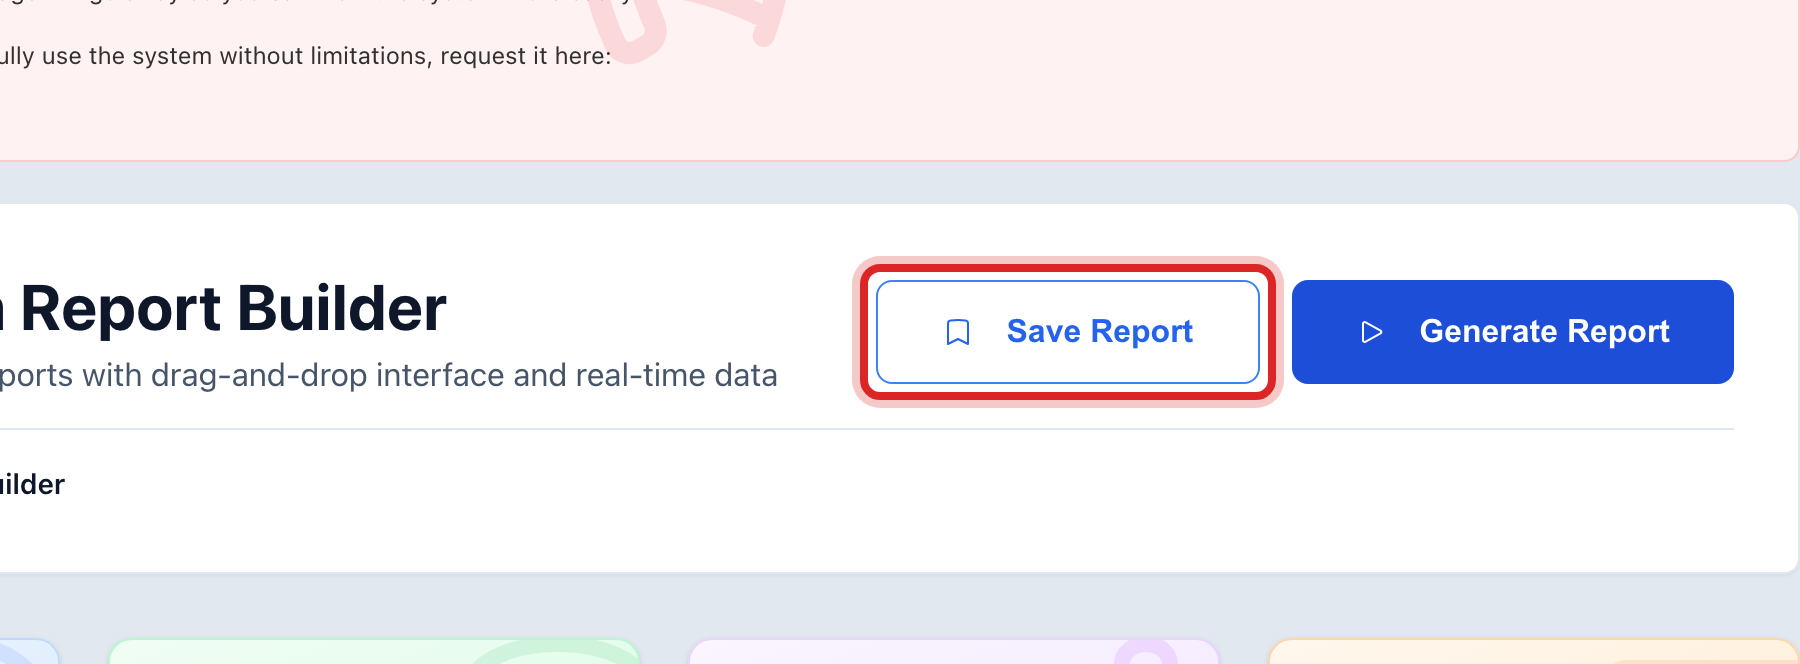
Want to run it again next month? Click Save Report at the top. It shows under Saved Reports at the bottom of the page.
Made a mistake? Click Undo on the green message that appears, or open Show me how at the top and pick Undo a mistake.
You are done when
The file is in your Downloads folder, or the print view opens in a new tab for PDF. If you saved it, the name shows under Saved Reports.
If something looks different
You cannot find a field. Click in the Search fields... box above the list and type part of the name.
You want only some rows. Under Filters & Options, pick a Date Range, or click Add Filter and set a rule, like balance greater than 100.
You want it sorted. Under Filters & Options, pick Sort By and Sort Direction.
The Generate Report button is not there. It appears once you have added at least one field.
You want to run a saved one. Under Saved Reports, click the pencil button on its card. It loads at the top. Then click Generate Report.