
Appearance
5. Read the month's money numbers
When you need this: before the board meeting, or when the manager asks "how are we doing?" This page turns your books into a few big numbers and charts. Money in, money owed, budget against actual. Nothing here can be changed, so look around.
Steps
On the left side of the screen, click Reports & Analytics, then click Financial Analytics.
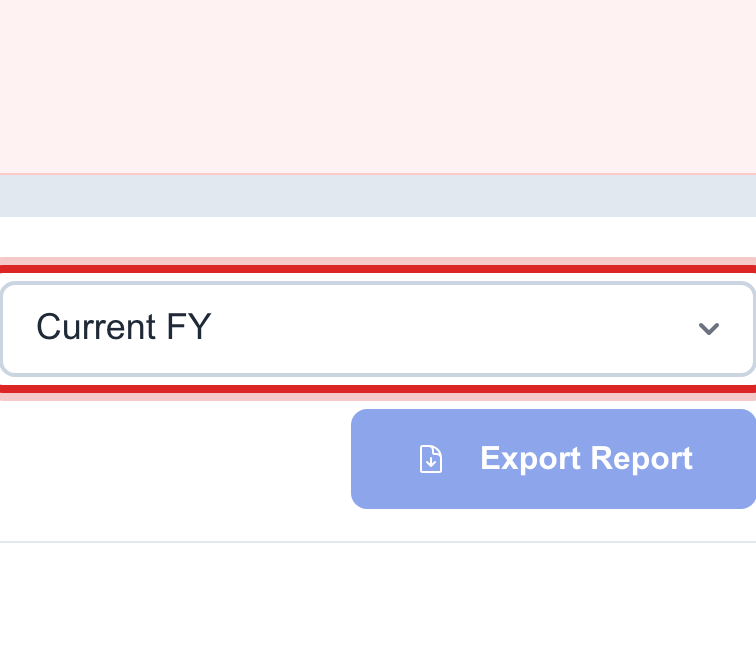
At the top right, click the period list. Pick Current FY for this fiscal year, Previous FY for last year, Year to Date or Quarterly.
The Financial Overview card shows the big numbers for that period. Revenue, what customers still owe, and how much of what you billed came in.
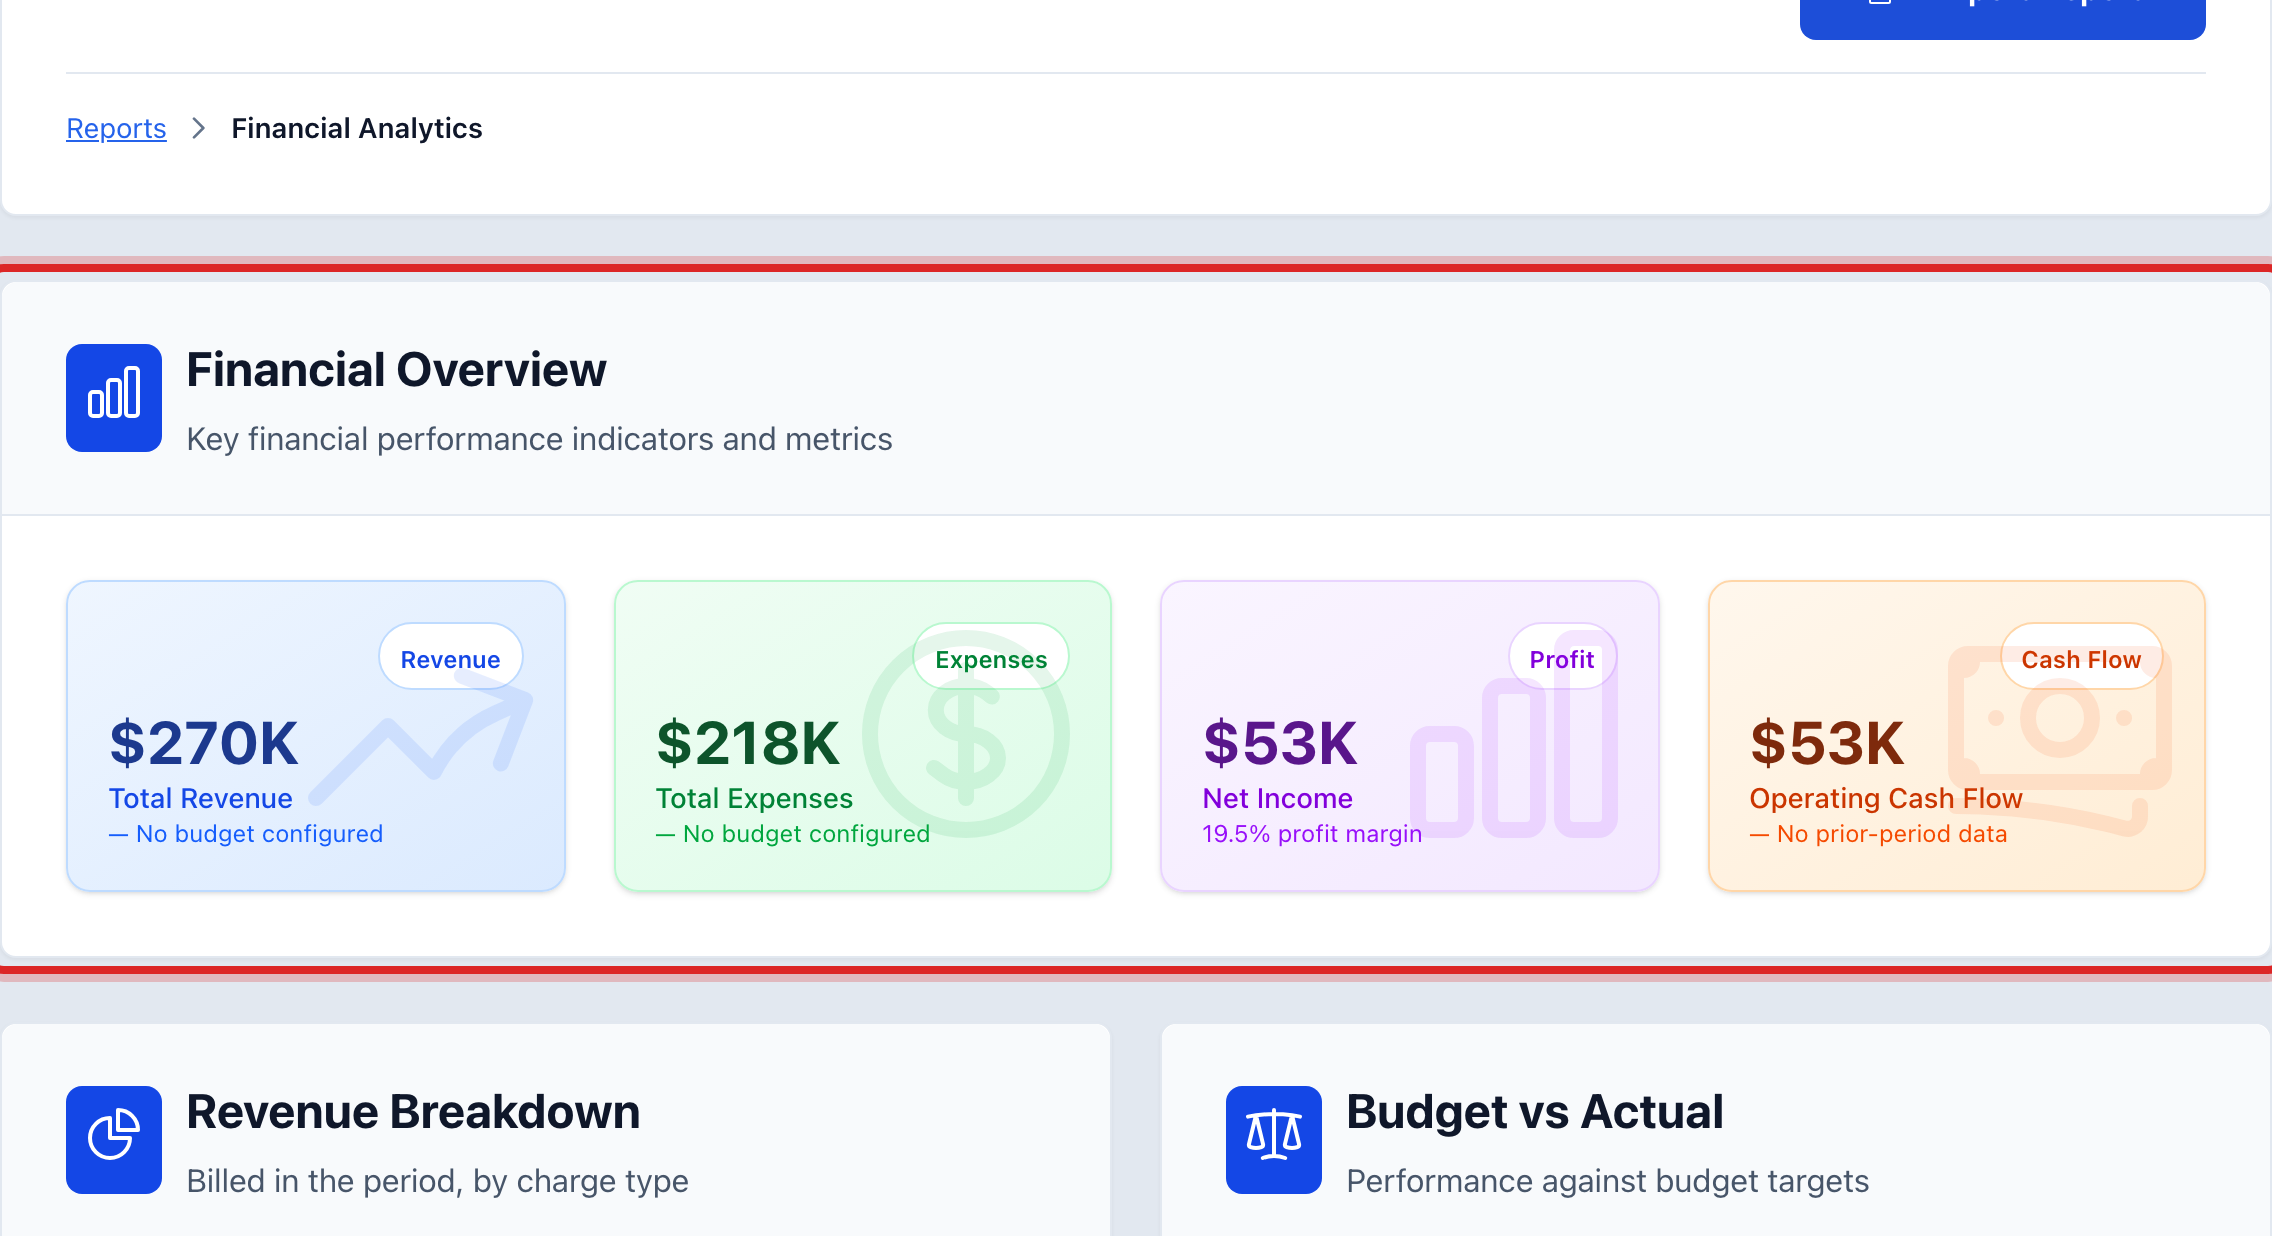
Scroll down. Revenue Breakdown shows where the money came from. Budget vs Actual shows how you are doing against the budget. Cash Flow Analysis shows money in and out by month.
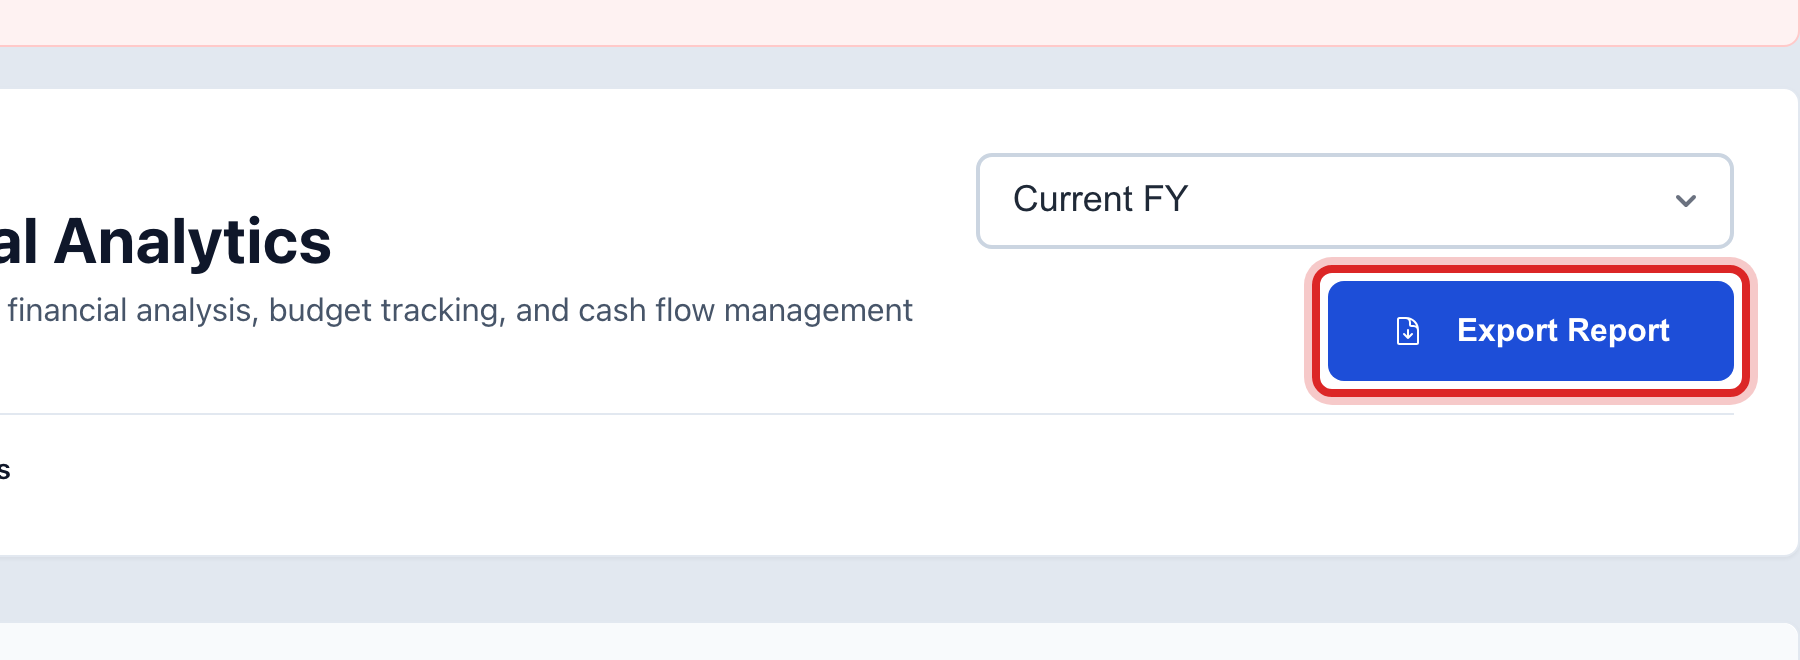
Want it on paper for the meeting? Click Export Report at the top.
You are done when
You can say, in one sentence, how much came in this period and how much is still owed. The export is in your Downloads folder if you asked for it.
If something looks different
Budget vs Actual is empty. No budget has been entered yet. Click Set Up Budget on that card. It takes you to Accounting, where the budget lives.
The numbers look low. Check the period list. Quarterly shows three months, not the year.
You want the real statements. The income statement and balance sheet are under Accounting, then Financial Reports. Those are what the auditor wants.
The page says there is no financial data. Your books have no posted entries for that period yet. Click Load Financial Data to try again after posting.